Box plots creation using R code
- Geoinformers
- Jan 28, 2018
- 1 min read
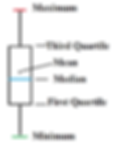
The Box plots are used to plot the statistical values in a simple way. The box plots draw the rectangles that represent first and third quartiles, with a vertical line that shows the median value of each rectangular box. The upper quartiles and lower quartiles are shown as horizontal lines either side of the rectangle. The mean values may be indicated by a point.

In R, it’s quite easy to create box plots. Here is the data used for box plots creation-

Data for mean values-

Box plots program for R-
#Read your data taht is savd in .csv formate and create a dataframe-
Dataframe = read.csv("Water_Varietywise.csv",header=T)
#Read Mean value of the above csv using a different file that is shown as mean.csv here-
means = read.csv("mean.csv",header=F)
#Using Boxplot function, we can create boxplots for our data. In the Ylab, y axis label is given as water (%) and in y axis label Crop Genotype is given-
boxplot(Dataframe, ylab ="Water (%)", xlab = "Crop Genotype", las = 1.5, font.lab=3, cex.lab=1.2, col = c("grey"))
#This line shows how point will look like in our plot- points(1:10, means, pch = 23, cex = 0.75, bg = "red")
YouTube Video-
Box plot in R-

using above steps, you can create box plots for your statistical data, cheers.
Author
Gopal Krishna
Ph.D. - Geoinformatics & Remote Sensing


